
Data Visualization
-
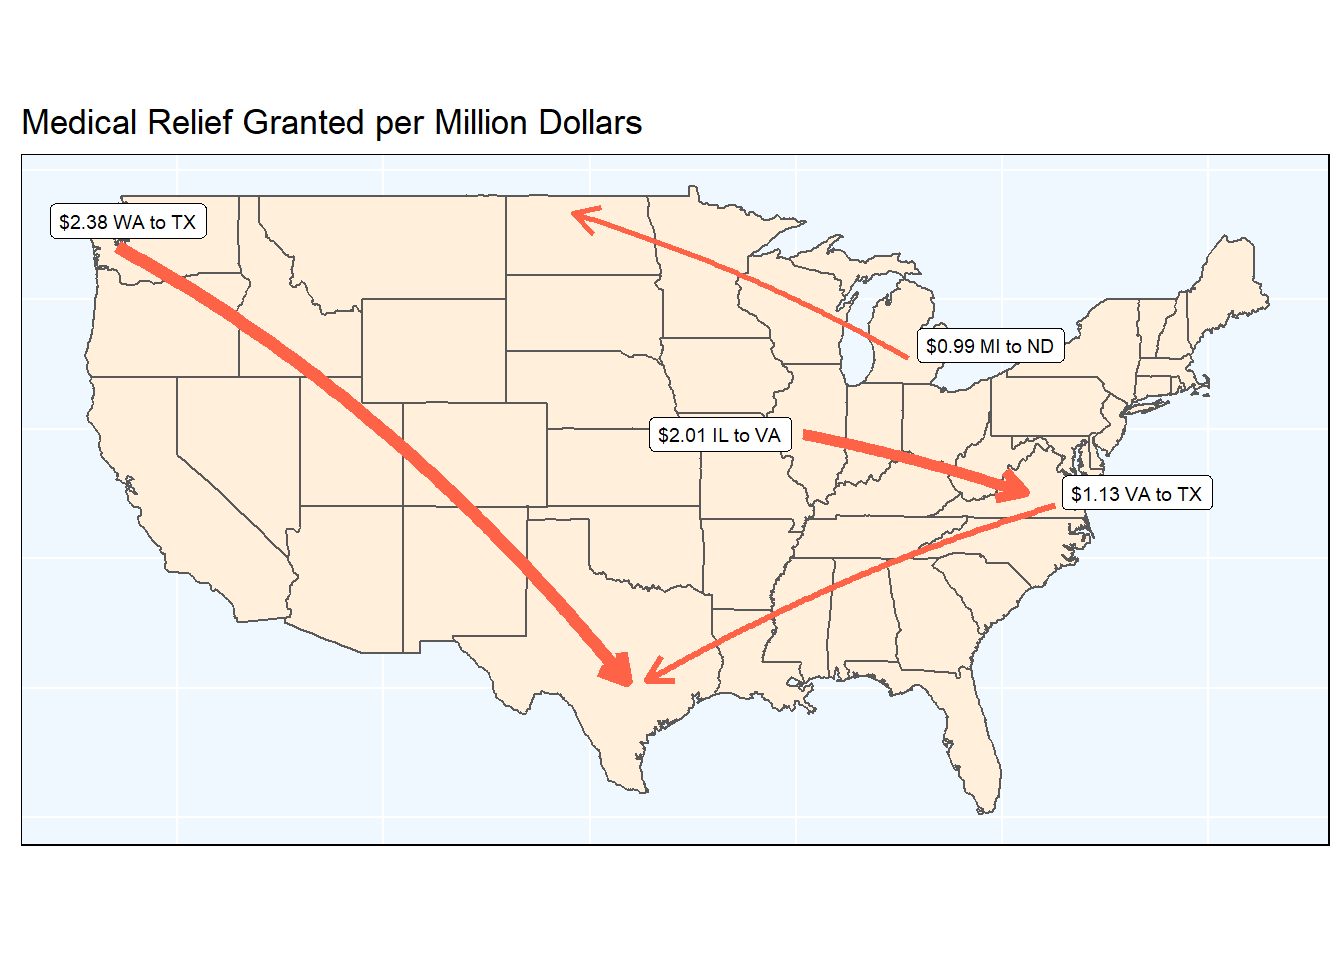
Directed Networks
How to show state-to-state interactions--be it the flow of money aid given, policy diffusion, or migration patterns between states.
-

Circular Graphs
An easy guide for how to display data in a circular format using
circlize. This tutorial supplements "Circular Visualization in R" by Zuguang Gu. -

`cjoint` Plots
A quick and easy guide to modifying and customizing the look of your AMCE plot outputs from
cjoint.
Workshops
-

Solving Programming Problems
Ever feel frustrated that Googling your solution doesn't seem to do much? This workshop will help you navigate was to problem solve coding issues in R on your own!
-

Map Functions
Have you ever needed a function to be applied to multiple elements, such as datasets? Instead of copy and pasting your code repeatedly,
mapfunctions can do this for you!
Beginner Guides
-
R Markdown for RStudio
The basics for understanding and using R Markdown in RStudio. -
Push, Pull, & Merge with Github
The basics for understanding how to commit, push, pull, and merge while using Github with RStudio.